Before we get into the weeds of dashboards, definitions, and data quality, here's the gist:
- Gut Feelings Have a Shelf Life: Instinct works great at ten people. Past that, delay becomes the enemy, the numbers usually start drifting six to eight weeks before you "feel" the problem. By the time you notice, it's already expensive.
- Reporting Isn't Business Intelligence, It's Just a Preview: Exporting a report every month doesn't make you data-driven. It makes you informed after the fact. Real business intelligence connects your systems, standardizes your definitions, and tells you what to actually do about what happened.
- Messy Data In, Messy Decisions Out: Garbage data wrecks even the prettiest dashboard. Clean definitions, trustworthy sources, and someone who actually owns each number beat any flashy platform every time.
- The Dashboard Should Change What You Do Monday Morning: If a KPI moving doesn't change staffing, pricing, or scoping, it was never intelligence, it was wallpaper. Good BI turns signal into action, fast.

A founder looks at the P&L, skims Slack, checks the pipeline, and says, "I think we're doing fine."
That sentence has buried a lot of margin.
The problem is rarely effort. It's visibility. When leadership teams rely on instinct, scattered spreadsheets, and month-end recaps, they miss the slow leaks that shape the business: a service line with shrinking profitability, a sales pipeline full of bad-fit leads, a delivery team that is technically busy but financially underperforming.
That's where business intelligence earns its keep.
If you're still asking what is business intelligence, the short answer is simple. Business intelligence is the process of collecting, organizing, analyzing, and presenting business data so people can make better decisions. IBM's overview of business intelligence describes BI as the processes and technologies used to gather, manage, and analyze organizational data. Microsoft's explanation of BI focuses on turning data into visual insights through reports and dashboards. Gartner's ABI glossary frames it as an umbrella term for the tools and practices that help organizations access and analyze information to improve decisions and performance. Tableau's guide to business intelligence lands in the same territory. Different phrasing, same point: stop guessing, start seeing.
For agencies and service businesses, that shift matters quickly. ScaleTime's SCALE. Framework puts reporting, business intelligence, and data analytics inside the operating baseline for growth, alongside sales systems, documentation, and team accountability. That is exactly where it belongs. A business that wants to scale cannot afford to discover operational truth by accident.
Gut Feelings Work, Until Complexity Shows Up
At a small size, instinct can carry a business further than people admit.
When the founder is still in sales, still reviewing deliverables, still involved in hiring, still aware of every invoice, pattern recognition is immediate. You do not need a sophisticated KPI dashboard to know a client relationship is wobbling when you were on the last three calls yourself.
That is not project management freedom, though. It's just a founder who hasn't automated their peripheral vision yet.
That stops working once the business adds layers.
The first layer is team growth. The second is service complexity. The third is delay. Delay is the killer. By the time a founder "feels" a problem in a twenty-person business, the numbers have often been drifting for six or eight weeks. Gross margin slipped. Utilization fell. Lead quality weakened. Onboarding time expanded. Client success teams compensated quietly. Nobody saw the whole picture because everyone saw only their piece.
This is why business intelligence for SMBs is not some enterprise luxury. It is a control system. It gives leadership a way to catch pattern changes before they harden into expensive habits.
IBM notes that BI supports access to historical and current data from internal and external sources so organizations can identify issues, trends, and opportunities. That matters because most operational problems do not announce themselves with one obvious metric. They appear as relationships between metrics. Revenue may still look healthy while delivery hours creep up. Win rate may hold steady while average deal quality deteriorates. Headcount may rise while output per employee flattens. That is exactly the kind of pattern a solid BI setup is meant to surface.
If you are running a service business, "we're busy" is not intelligence. It's noise.
Business Intelligence Is Not Just Reporting With Prettier Charts

A lot of companies think they already have BI because someone exports a few reports every month.
That is reporting. Reporting has value. It is not the same thing.
Gartner's framing of analytics and business intelligence platforms centers on technology that enables organizations to analyze and visualize data in support of better decisions. The important phrase is better decisions. BI is decision infrastructure, not decorative reporting.
Here is the practical distinction.
Basic reporting tells you what happened.
Business intelligence helps you understand what happened, where it happened, who is affected, whether it is recurring, and what deserves intervention first.
That difference shows up in system design. Strong business intelligence software connects data across business functions, standardizes definitions, presents shared KPIs, and makes exceptions obvious. It lets a leadership team move from anecdotal management to operational management.
In a healthy BI environment, your sales lead sees pipeline velocity by source. Your operations lead sees capacity against committed work. Your account team sees retention risk indicators. Your finance lead sees margin by client, team, and service category. Leadership sees the whole stack in one place.
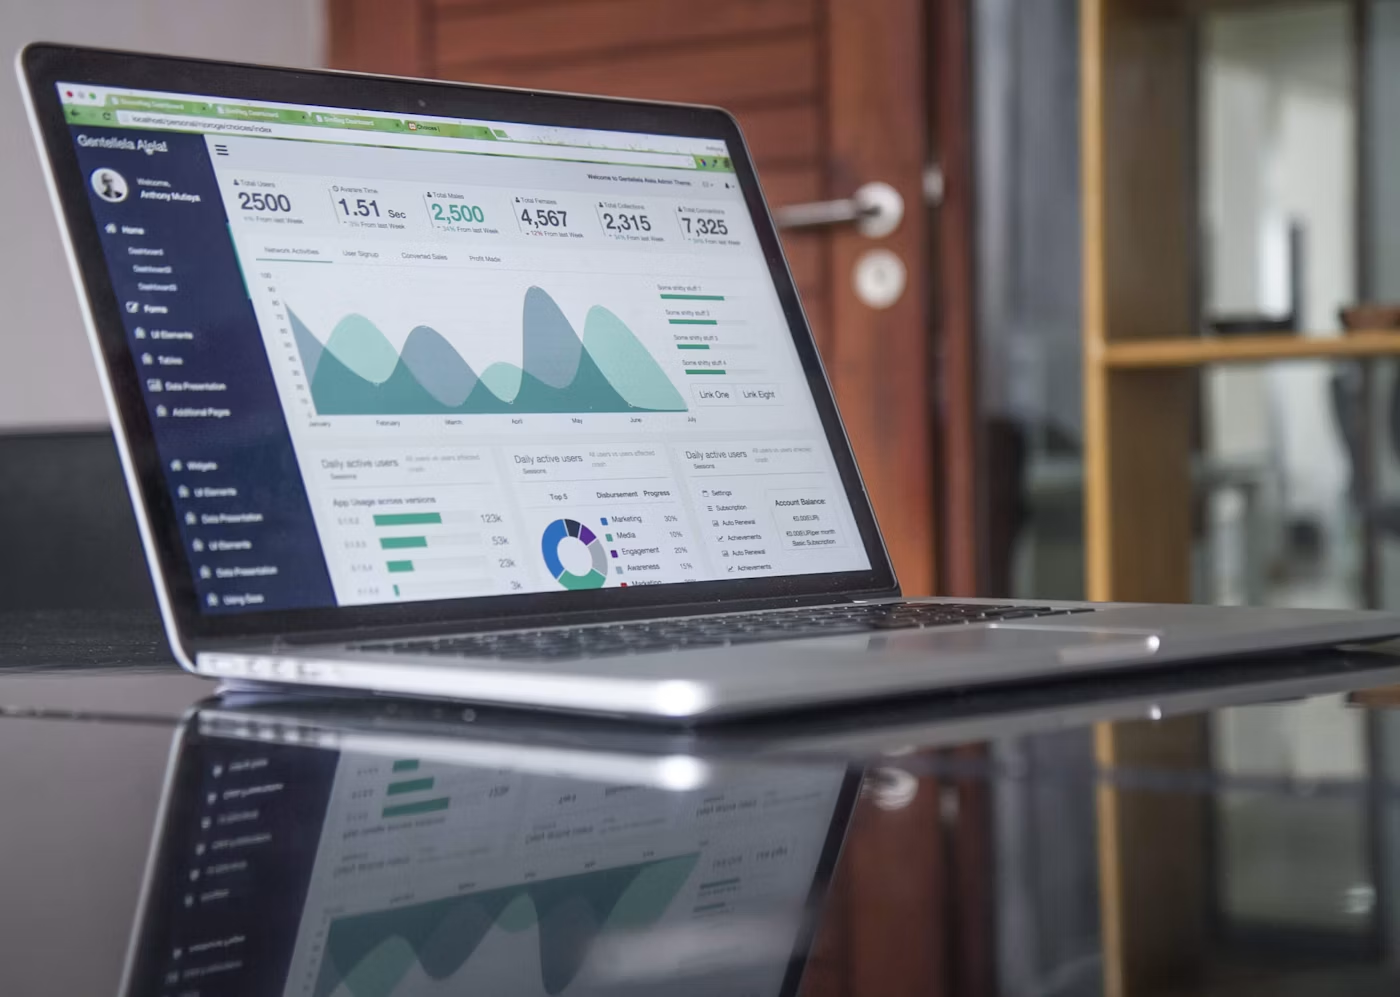
That is why data dashboards for small business can be so useful when they are built correctly. They compress decision time. They reduce fights about interpretation. They create one shared version of reality.
Business Intelligence vs. Business Analytics: What's the Difference?
People throw these terms around like they're the same thing. They're not.
Gartner's ABI glossary treats analytics and business intelligence as one umbrella, the applications and best practices that help teams access and analyze information. But inside that umbrella, there's a split. Business intelligence tells you what happened and where. Business analytics goes a step further, using statistical methods to predict what happens next.
Think of it this way: BI is the rearview mirror. Predictive analytics and, in more advanced setups, prescriptive analytics is the GPS rerouting you before you hit traffic.
Most agencies don't need to master both on day one. Nail the rearview mirror first. You cannot forecast a problem you have never bothered to measure.
Why This Matters So Much for Agencies and Other SMBs
Small and mid-sized businesses tend to share the same blind spots.
They track revenue, because everyone tracks revenue.
They may track cash, because payroll forces the issue.
Then things get fuzzy.
How profitable is each client after labor burden? Which delivery teams are over capacity? Which project types routinely run long? Which acquisition channels generate long-retention accounts instead of quick wins? Which account managers retain revenue best? How long does it actually take a new hire to become productive? Where are approvals slowing production?
Those are BI questions.
ScaleTime makes a blunt point in its own guidance: the tools matter less than whether the system is affordable, consistent, actually used by the team, and capable of supporting reporting and dashboards. That is exactly right. A fancy stack with bad adoption is weaker than a simple stack with disciplined usage. The operational goal is not a flashy interface. The goal is a reliable chain from source data to action.
This is also where many business intelligence platforms get oversold. SMBs do not need an enterprise moonshot. They need a dependable way to answer the same core questions every week without debating the math.
What was our real delivery margin last month?
How many days does a deal sit in proposal stage?
Which clients consume the most senior labor?
How many projects crossed deadline because of internal bottlenecks rather than client delays?
If your team argues about the number every time one of those questions comes up, you do not have business intelligence yet.
Garbage In, Data Governance Out
Here's an inconvenient truth. None of this works if the raw data feeding your dashboards is garbage.
IBM's breakdown of data quality puts it bluntly: bad data in means bad predictions out, whether a human or an algorithm is doing the analyzing. If your data sources are inconsistent, if two systems define "active client" differently, if someone fat-fingered a deal size into the CRM, your dashboard is just a confident-looking lie.
This is not a hypothetical cost. Gartner's research on data quality puts the average annual cost of poor data quality at $12.9 million for the organizations it studies. Your agency is not losing eight figures. But you are absolutely losing hours, deals, and trust every time someone has to stop a meeting and ask, "Wait, where did that number come from?"
Data governance is not a Fortune 500 luxury. It's the unglamorous work of deciding who owns a number before the number starts an argument and it belongs right alongside your other business operations disciplines, not off in some separate IT lane.
The Real Job of a Business Intelligence Analyst
A lot of leaders hear business intelligence analyst and picture a technical specialist buried in SQL all day.
That can be part of the role. It is not the whole role.
The best BI analysts translate business questions into measurable logic. They define metrics, clean up source data, connect systems, build dashboards, and explain what leadership should pay attention to. In strong organizations, they are less like report builders and more like interpreters of operational truth.
That role matters because dashboards do not create clarity on their own. Someone has to decide what belongs on them.
A weak dashboard answers every possible question badly. A strong KPI dashboard answers the handful of decisions the business actually needs to make this week.
For an agency, that might include:
- gross margin by client and service line
- billable utilization by team
- project aging
- sales velocity by lead source
- retention by cohort
- average onboarding cycle time
- forecasted capacity shortfall over the next thirty days
Those are not just numbers. They are management levers.
IBM also points to the rise of self-service BI, where nontechnical users can analyze and report on data more directly. That is useful, but only when metric definitions are governed. Self-service without shared definitions creates dashboard sprawl. Everybody gets a chart. Nobody gets alignment.
Choosing Business Intelligence Tools Without Overcomplicating the Problem

Start by getting clear on your project management objectives, then work backward into the platform that supports them.
The market for business intelligence tools is crowded, and most comparison roundups make the choice sound more dramatic than it is.
A Forbes Advisor roundup of business intelligence tools points to widely used names such as Microsoft Power BI and Tableau because they remain standard choices for visualization and BI work. Power BI often appeals to smaller teams because it fits naturally into Microsoft-heavy environments. Tableau is still widely recognized for strong visual analysis. Those are real differences, but the larger decision is not brand selection. It is operational design.
Before you choose a platform, answer these questions:
Do we know which decisions need support?
Do we trust the source data?
Do we have clear KPI definitions?
Do we need daily visibility, weekly visibility, or real-time visibility?
Who owns dashboard maintenance?
What action should follow when a number moves outside range?
That last question gets skipped all the time. It should not.
A dashboard without an action path is executive wallpaper.
For most SMBs, the best business intelligence software is software the team can maintain, understand, and use consistently. If your stack is too technical, ownership drifts to one person and adoption dies. If it is too shallow, you get pretty charts that cannot answer real questions.
The sweet spot is usually a business intelligence platform that pulls from the systems you already depend on, applies basic modeling cleanly, and distributes role-specific dashboards without a giant implementation burden.
Connecting the Dots: Data Integration and Your CRM
A business intelligence platform is only as good as the pipes feeding it.
Most agencies already have the raw ingredients: a CRM, a project management tool, a finance system, maybe a time-tracking app. The problem is these systems rarely talk to each other. IBM's overview of CRM integration notes that connecting CRM platforms with the rest of your stack creates a single source of truth — one number for pipeline, one number for revenue, one number everyone actually trusts.
This is data integration in practice: not a fancy engineering project, just making sure your data collection points stop living in silos. For SMBs that outgrow spreadsheets, that often means routing everything into a lightweight data warehouse, a central repository built specifically to support the kind of queries and analysis your dashboards are running.
Get the plumbing right, and the dashboard stops being the hard part.
What a Useful KPI Dashboard Actually Looks Like
Most dashboards fail for one of two reasons.
They are too broad, or they are too late.
A useful KPI dashboard is narrow enough to drive action and fresh enough to matter. It should tell the viewer three things quickly:
- Are we on track?
- Where is the variance?
- What needs attention now?
For a small business data reporting setup, that usually means separate dashboard layers.
The executive dashboard should stay high level: revenue, margin, cash, sales pipeline health, capacity, retention, forecast variance.
The department dashboard goes one level deeper. Sales gets conversion by stage and source, pipeline aging, average deal size, and velocity. Operations gets utilization, delivery margin, overdue tasks, capacity strain, and project cycle times. Client success gets expansion, churn risk, satisfaction signals, and issue trends.
The contributor dashboard should focus on controllable inputs. A person cannot improve company profitability directly. They can improve proposal turnaround time, handoff completeness, task aging, QA error rates, or client response speed.
That structure keeps the dashboard system tied to behavior.
ScaleTime already leans into this operating mindset in its own articles on digital marketing agency KPIs and sales process KPIs. The through-line is right: decisions should be based on data, and KPIs should connect directly to goals and accountability.
Make It Visual: Data Visualization That Actually Gets Used
A brilliant dataset nobody looks at twice is worthless.
Tableau's own guide to data visualization makes the case plainly: turning numbers into charts and interactive dashboards is what lets people spot a pattern in three seconds instead of thirty minutes buried in a spreadsheet. That's the whole point of data visualization: it is not decoration, it is speed.
For agency leadership, that means resisting the urge to cram every metric onto one screen. A clean bar chart beats a busy one every time. Interactive dashboards that let a sales lead filter by source, or an ops lead filter by team, do more work than a static PDF ever will.
If your team squints at a dashboard and asks what it means, the visualization failed before the data did.
BI Exposes the Expensive Lies Businesses Tell Themselves
Every growing company carries a few stories that feel true until the data gets involved.
"Our biggest clients are our most profitable."
"More leads will solve the pipeline problem."
"We're understaffed."
"The team just needs to move faster."
"Our churn is random."
Sometimes those claims are true. Often they are camouflage.
Business intelligence software helps strip away the story and show the mechanism underneath it.
A large client may produce impressive revenue and weak margin because the account consumes senior labor, revision cycles, and off-scope attention.
A pipeline problem may actually be a qualification problem, where low-fit leads inflate activity and waste sales effort.
An "understaffed" delivery team may be dealing with poor project scoping, approval loops, and fragmented workflows rather than a true labor shortage. Sometimes it's a market trends problem in disguise, the whole industry's lead quality softened for a quarter, and no one checked before panicking about headcount.
A churn problem may be concentrated in one offer, one client segment, or one onboarding path.
This is why a well-built business intelligence platform changes management quality. It creates enough evidence to challenge assumptions early. Leadership no longer has to choose between anecdote and chaos. The numbers narrow the conversation.
That does not remove judgment. It improves judgment.
What to Measure First if You Are Building BI From Scratch
If you are starting from zero, resist the urge to track everything.
Start where money, time, and execution meet.
If ranking five categories at once feels overwhelming, a simple prioritization matrix forces the choice: what's high impact, what's not, and what can wait.
For most SMBs, that means five measurement zones.
1. Revenue quality
Track revenue by client, service line, source, and retention profile. You want to know where good revenue comes from, not just how much arrived.
2. Margin reality
Gross revenue hides a lot. Measure delivery cost against revenue so you can see margin by client, team, project type, or offer. This is where many "good" months turn out to be mediocre.
3. Sales movement
Do not just look at close rate. Measure stage conversion, deal velocity, source quality, and average days in pipeline. A full pipeline can still be weak.
4. Capacity and throughput
You need visibility into utilization, project aging, overdue work, and forecasted resource gaps. Agencies often discover too late that the issue is not lack of sales, it is unstable delivery bandwidth.
5. Retention and expansion
Track client churn, contraction, upsell, renewal timing, and issue patterns. Long-term growth usually gets decided here.
This gives you a minimum viable BI system. Once those are stable, layer in hiring, onboarding, quality control, and customer experience metrics.
ScaleTime's article on hiring and onboarding KPIs makes the same point in a different function: measure the process steps that actually predict business performance, including time to hire, quality of hire, and time to productivity. The principle scales across the company.
The Hidden Prerequisite: Clean Definitions

Most BI failures are not software failures. They are definition failures.
Ask five leaders to define active client, qualified opportunity, or utilization, and you may get five different answers. Once that happens, every dashboard becomes negotiable.
This is why the best business intelligence systems begin with metric governance.
Define each KPI in writing.
Define the data source.
Define the owner.
Define the refresh cadence.
Define the threshold that triggers action.
Write it up once in a shared process documentation template, and the argument ends before it starts.
Without those rules, small business data reporting turns into a weekly argument club.
This is also why business intelligence for SMBs should be treated as an operations initiative, not just a tech project. The work is partly technical, yes. It is also managerial. The system has to reflect how the business actually runs and who is accountable when numbers shift.
Whether that meeting happens in a conference room or over one of the better screen sharing apps for distributed teams, the fix is the same.
If your reporting meetings routinely devolve into "that number doesn't look right," the problem is upstream.
Business Intelligence Should Change Behavior Fast
Good BI creates a tighter loop between signal and response.
That might mean sales adjusts targeting after seeing a decline in qualified opportunities from one channel.
It might mean operations changes scoping after a dashboard shows one service package running 22 percent over estimated labor for three straight months.
It might mean leadership discovers that one account segment retains well but pays too slowly, creating a cash strain that growth alone will not fix.
This is where BI becomes strategic. It is not there to impress stakeholders with visual sophistication. It is there to make the next move clearer.
Microsoft's framing of BI around actionable visual insights is useful here because action is the point. If the insight does not alter planning, staffing, prioritization, pricing, or process, it has not yet become intelligence in any meaningful sense.
And this is the deeper reason to stop running your business on gut feelings. Gut feelings are hard to audit. They are harder to transfer. They do not scale well beyond the founder.
A dashboard does.
A shared metric does.
A disciplined reporting rhythm does.
The Companies That Benefit Most Are Usually Not the Biggest

The firms that get the sharpest gains from BI are often those in the messy middle.
They are large enough to feel complexity, small enough to fix it quickly.
They do not need a year-long transformation project. They need visibility into the handful of constraints slowing growth. Once those constraints are visible, improvement gets practical. Meetings get shorter. Forecasts get tighter. Hiring gets smarter. Pricing gets less emotional. Delivery gets more predictable.
That is the real promise of business intelligence tools and business intelligence platforms for growing firms. Better charts are nice. Better decisions are the payoff.
ScaleTime's positioning on its homepage speaks directly to that transition: helping owners move from doing everything to building systems that support growth. Business intelligence belongs in that system stack because growth without visibility usually turns into complexity without control.
Founders are right to trust experience. Experience matters.
But experience works best when it has evidence. HBS research citing a PwC survey of more than 1,000 senior executives found that highly data-driven organizations are three times more likely to report significant improvements in decision-making than those that lean less on data. That is not a small edge. That is the difference between guessing well and knowing.
If your business still runs on scattered reports, hallway updates, and a strong sense that things are probably fine, you do not have a data problem. You have a decision problem.
Business intelligence fixes that by making the business legible.
Once a business becomes legible, it becomes much easier to lead.
Most agencies don't need a new platform before any of this works. They need an honest read on where the data already breaks down — which definitions are shaky, which systems don't talk to each other, which numbers nobody actually trusts. Get your free ScaleMap assessment and see exactly where those cracks are before you spend a dime on new BI software.







%20(1).gif)


