
Take these action steps to build a business intelligence system that actually drives decisions, not just decoration.
- Not Just a Fancier Report: A static report tells you what already happened. A real BI system tracks what's happening right now, so you catch the margin leak before it becomes a "wait, what happened to Q3?!" moment.
- 47 Charts Is a Red Flag: More dashboards do not equal more insight. Pick the handful of numbers that actually move the business and ditch the rest, because your KPI dashboard is not a trophy case.
- One Truth or Bust: If finance and sales define "revenue" two different ways, congrats, you have built a very expensive argument generator. Nail down your definitions before you nail down your dashboards.
- Start Small, Then Scale: Pick one business question, build one clean dashboard around it, and expand from there. The software is the easy part. Deciding what deserves your attention is the real work.

Most owners do not have a data problem. They have a visibility problem.
Revenue is coming in, clients move through the pipeline, projects ship. Then someone asks "Which service line is actually the most profitable?" and the room goes quiet.
That is where business intelligence earns its keep.
What Is Business Intelligence, Really?
Business intelligence is the practice of collecting, organizing, analyzing, and visualizing business data so you can make sense of your business operations and make better decisions, faster. IBM defines business intelligence as the set of processes and technologies that turn raw data into insights that guide strategy and operations. Tableau frames it as an umbrella term covering data collection, storage, business analytics, and data visualization, all working together to help you see what is actually happening.
In plain English, business intelligence basics come down to one idea. Get the right data, in the right format, in front of the right person, fast enough to act on it.
If you have ever pulled numbers from your CRM, your accounting platform, your project management tool, and a spreadsheet graveyard just to build one weekly report, you already understand why BI matters.
Descriptive, Predictive, and Prescriptive Analytics
BI tools cover more ground than most owners realize. IBM breaks analytics into three flavors: descriptive analytics tells you what already happened, predictive analytics forecasts what is likely to happen next, and prescriptive analytics recommends what to do about it.
Most small businesses live almost entirely in descriptive territory: dashboards that show last month's numbers. That is a fine place to start. But once your data collection and data quality are solid, predictive analytics and prescriptive analytics stop being enterprise luxuries and start flagging demand shifts or churn risk before they hit — the same forecasting logic now shows up in AI project management tools that flag scheduling risk before a deadline slips.
Business Intelligence Is More Than a Prettier Report

A lot of people still treat BI like a fancier monthly report. That undersells it, badly. A static report tells you what happened last month, while a strong BI system tracks what is happening right now and flags problems before they turn into margin leaks.
Reports vs. Dashboards
IBM notes that BI is primarily descriptive, meaning it answers what happened, where performance shifted, and which market trends are emerging. Tableau draws a useful line here too: dashboards give you a high-level, real-time view of key metrics, while reports go deeper and stay more fixed in format.
That distinction matters for operators and founders. You do not need a 26-tab spreadsheet every Monday morning. You need one KPI dashboard that shows whether sales, delivery, retention, or cash flow moved in the wrong direction.
For service businesses, that might mean proposal-to-close rate, project cycle time, customer retention, and gross margin by service. For product businesses, it might be conversion rate and inventory turns. The dashboard itself is not the point, making the decision before the month ends is.
The Four Parts of a Working BI System
Most business intelligence platforms run on four parts. If one is weak, the whole system gets shaky.
Data Sources: Where Everything Starts
Your data sources include your CRM, accounting platform, payment processor, ad platforms, project tools, support systems, ecommerce, even social media. Some is internal data you already own. Some is external data, like market trends or big data feeds, that adds business context you cannot generate alone.
Data Integration and Data Warehousing: Bringing It Together
Data integration pulls information from disconnected systems into one place. Without it, you are stuck comparing numbers never meant to talk to each other. This is also where data warehousing comes in, a structured system for data storage that keeps everything queryable and consistent.
Storage, Modeling, and Self-Service BI
Tableau describes this as the data warehouse layer, where integrated data is modeled so it can be trusted. Good data modeling is what makes self-service BI possible. Tableau's own governance research points out that governance is what enables self-service, not what blocks it which explains why self-service BI tools are growing at roughly 25 percent a year.
Reporting and Data Visualization: The Visible Layer
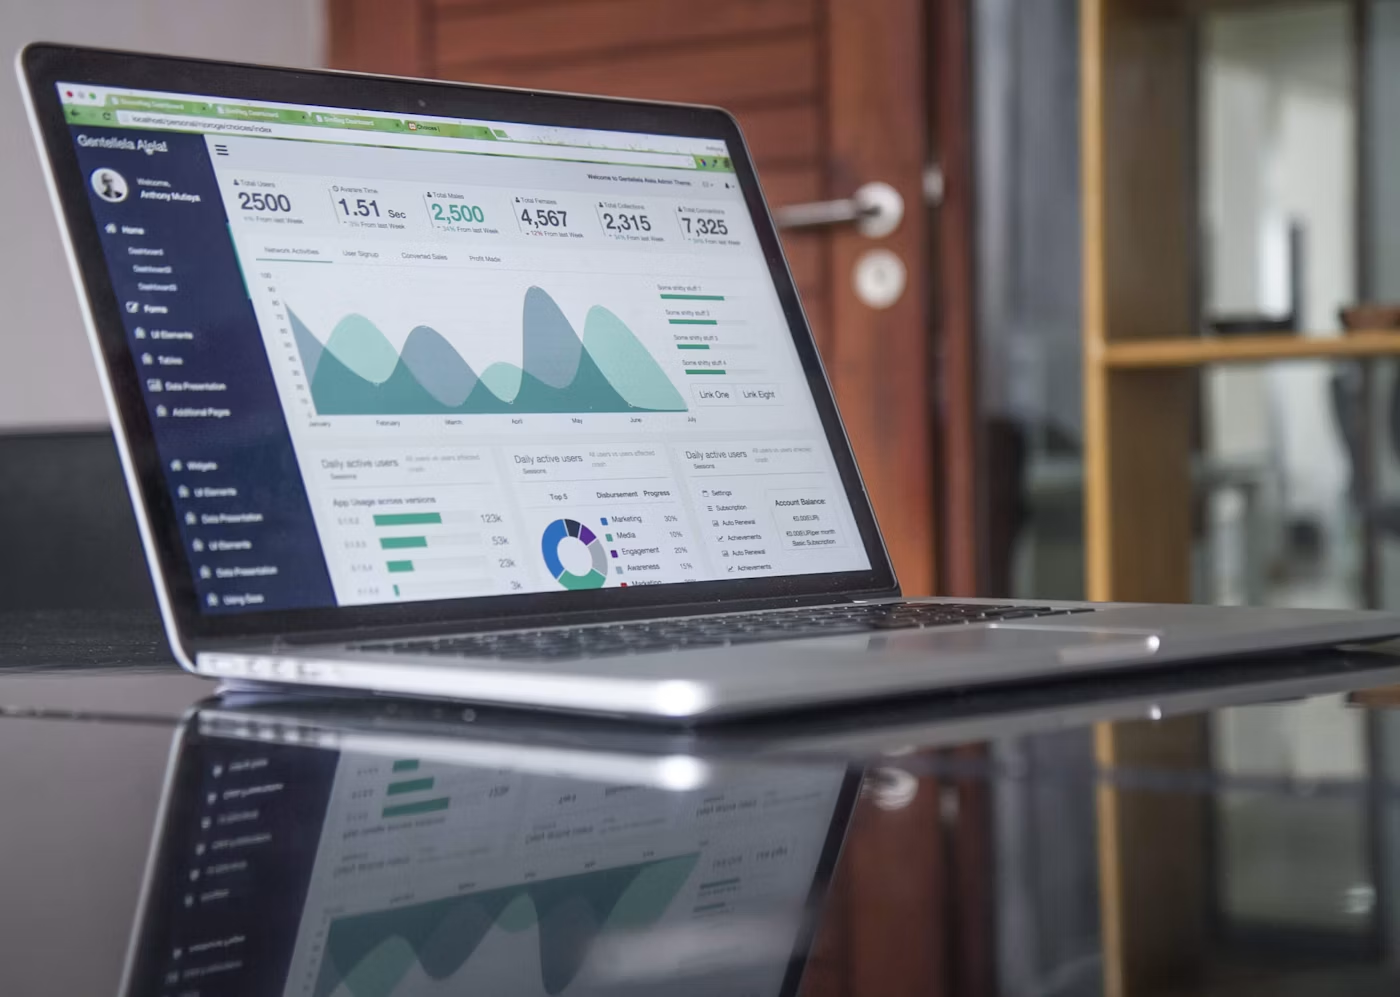
This is what everyone pictures when they hear "business intelligence software": charts, scorecards, trendlines, interactive dashboards — the payoff for getting the first three layers right. If finance defines revenue one way and sales defines it another, your KPI dashboard becomes decoration instead of a decision-making system.
Why Small Businesses Should Care About BI Systems

BI often gets framed as an enterprise-only discipline. That is outdated. Tableau explicitly notes that small and midsize businesses can run modern BI platforms without a massive infrastructure investment, and BI usage has been shown to boost decision-making speed by roughly 27 percent.
Smaller companies feel operational drag faster than anyone. A ten-person agency cannot burn hours every week building reports by hand. A founder-led firm cannot keep every number in the owner's head forever. Growing teams need shared visibility once performance starts splitting across departments.
This is where ScaleTime's SCALE. Framework lines up with BI. The framework leans on metrics, dashboards, and owner oversight; exactly how business intelligence earns its keep. BI is not a software purchase. It is part of building a business that runs on less chaos and more control.
What Business Intelligence Tools Actually Do
Business intelligence tools sit between raw data and the decision you actually need to make.
They pull data from multiple systems, including customer interactions, clean it up, and turn it into visual views people understand fast. Microsoft's Power BI overview highlights self-service analysis and interactive visuals as core features; IBM points to dashboards, charts, and maps as common outputs.
Good BI software usually helps with:
- connecting multiple data sources
- building dashboards for different roles
- tracking market trends and performance over time
- drilling into problem areas
- sharing customer insights across teams
- reducing manual reporting work
The value shows up the moment leaders stop assembling data and start using it.
What a Business Intelligence Analyst Does

A business intelligence analyst turns raw numbers into decisions people can act on: cleaning data, defining metrics, running data analysis, and translating statistical analysis into plain language for non-technical stakeholders.
In some companies, this is a dedicated hire. In smaller firms, the work gets spread across operations, finance, and leadership until the reporting burden gets too heavy.
When the Reporting Burden Gets Heavy
That arrangement works for a while. Then growth creates complexity, and the question stops being "What is business intelligence?" It becomes "Who owns the truth in this business?" If no one owns definitions and data quality, your dashboards will start arguments instead of creating clarity.
The Most Common BI Mistakes
The first mistake is tracking too much. A KPI dashboard should help a leader decide quickly — if it has 47 charts, it is already failing. Start with the handful of numbers that actually move the business.
The second mistake is confusing availability with usefulness. Your tools being able to export data does not make that data decision-ready.
Skipping Data Governance
The third mistake is skipping governance, the discipline that keeps your data and business processes aligned. Tableau calls governance critical to keeping users on accurate, consistent information. That sounds dry until two department heads show up with two different versions of the same metric. Left unmanaged, this is exactly how data silos form, quietly hurting the customer experience and costing teams hours every week chasing down the "real" number.
The fourth mistake is building dashboards with no operational rhythm behind them. Metrics only matter if someone reviews them, assigns action, and follows up — ScaleTime's own content on digital marketing agency KPIs makes this point well.
Where to Start With Business Intelligence Basics

Start smaller than you think.
Pick one business question that actually matters. Which clients are most profitable? Where are deals getting stuck? Then identify which systems hold the answer, define your metrics carefully, and build one clean dashboard around that single problem.
A useful first KPI dashboard might include:
- revenue by service line
- gross margin by client
- sales pipeline by stage
- project delivery timeline
- team utilization against target
Once that foundation holds steady, expand from there. Business intelligence platforms are powerful, but the software is the easy part. The hard part is deciding which numbers deserve your attention.
That is the real lesson in Business Intelligence 101. BI is not a luxury reserved for big companies with giant data teams. It is a practical operating discipline for owners who want clearer decisions, tighter execution, and fewer surprises.
You do not need forty-seven charts to run this business well. You need to know which handful of numbers actually matter, and a system that keeps them in front of you every week. ScaleTime's free ScaleMap takes an honest look at how your operations run today, no BI software required to start. Get yours and find out which numbers you should actually be watching.






%20(1).gif)


